 WMO
WMO
WORLD BANK: STATE AND TRENDS 2026, CARBON PRICING
Direct carbon pricing policies now covers 29 percent of global GHG emissions, with 47 carbon taxes and 40 ETSs implemented. If additional policies currently under development are implemented, global coverage will increase to nearly one-third of global GHG emissions. In the past year, average carbon prices have increased by over seven percent, adjusting for inflation, with increases across both ETSs and carbon taxes (the highest average prices are in Europe and Central Asia). Global ETS and carbon tax revenues rose by around two percent to generate US$ 107 billion in 2025.
2.1 Direct carbon pricing covers 29% of global GHG emissions across 87 implemented policies
As of April 1, 2026, 87 carbon pricing instruments (ETSs and carbon taxes) are in force across 47 countries and a regional ETS in the European Union. India launched its national Carbon Credit Trading Scheme (CCTS), Japan’s GX-ETS system entered its mandatory phase on April 1, 2026. Viet Nam’s ETS is in effect. National carbon taxes have also been implemented in Mauritania and Serbia. A further six ETSs and three carbon taxes are under development at the national level. A potential price on GHG emissions from international shipping remains under discussion at the International Maritime Organization (IMO). The implementation of three new ETSs reinforces the trend of the last decade, in which growth in emissions trading systems has outpaced carbon taxes.
Comparing the growth of CarbonTaxes and ETSs from 2016 to 2026
Carbon taxes and ETSs have both grown in the past decade. Policy makers examine each instrument to determine which is best suited for their policy mix and local circumstances. In some instances, governments have pursued both simultaneously, by using different instruments for separate GHG emissions sources or deploying both instruments on the same emissions sources. In Latin America, for example, the governments of Colombia, Chile, and Mexico have both a national carbon tax and ETS either implemented or under development. Similarly, the UK operates a national ETS combined with its carbon price support that provides a minimum carbon price for the power sector in England, Scotland and Wales.
However, ETSs cover a larger portion of emissions, with higher average carbon prices and revenue collected, than carbon taxes. The number of carbon taxes implemented since 2016 is higher than ETSs (26 and 21, respectively). However, the proportion of global GHG emissions covered by ETSs has tripled over the period, from under eight percent to around 26 percent, whereas the contribution of carbon taxes to global coverage has remained steady at around four to five percent (with roughly two percent of global GHG emissions in 2026 covered by both a carbon tax and ETS). Importantly, the estimate of global carbon tax coverage includes direct carbon taxes. Indirect carbon pricing also contributes significant additional coverage: fuel excise taxes cover approximately 24 percent of GHG emissions across 79 countries according to the Organisation for Economic Co-operation and Development (OECD), although this does include overlaps with direct carbon pricing in some cases.13 Similarly, average permit prices across implemented ETSs have more than doubled since 2016, whereas the average price in carbon taxes only increased 25 percent over the same period.
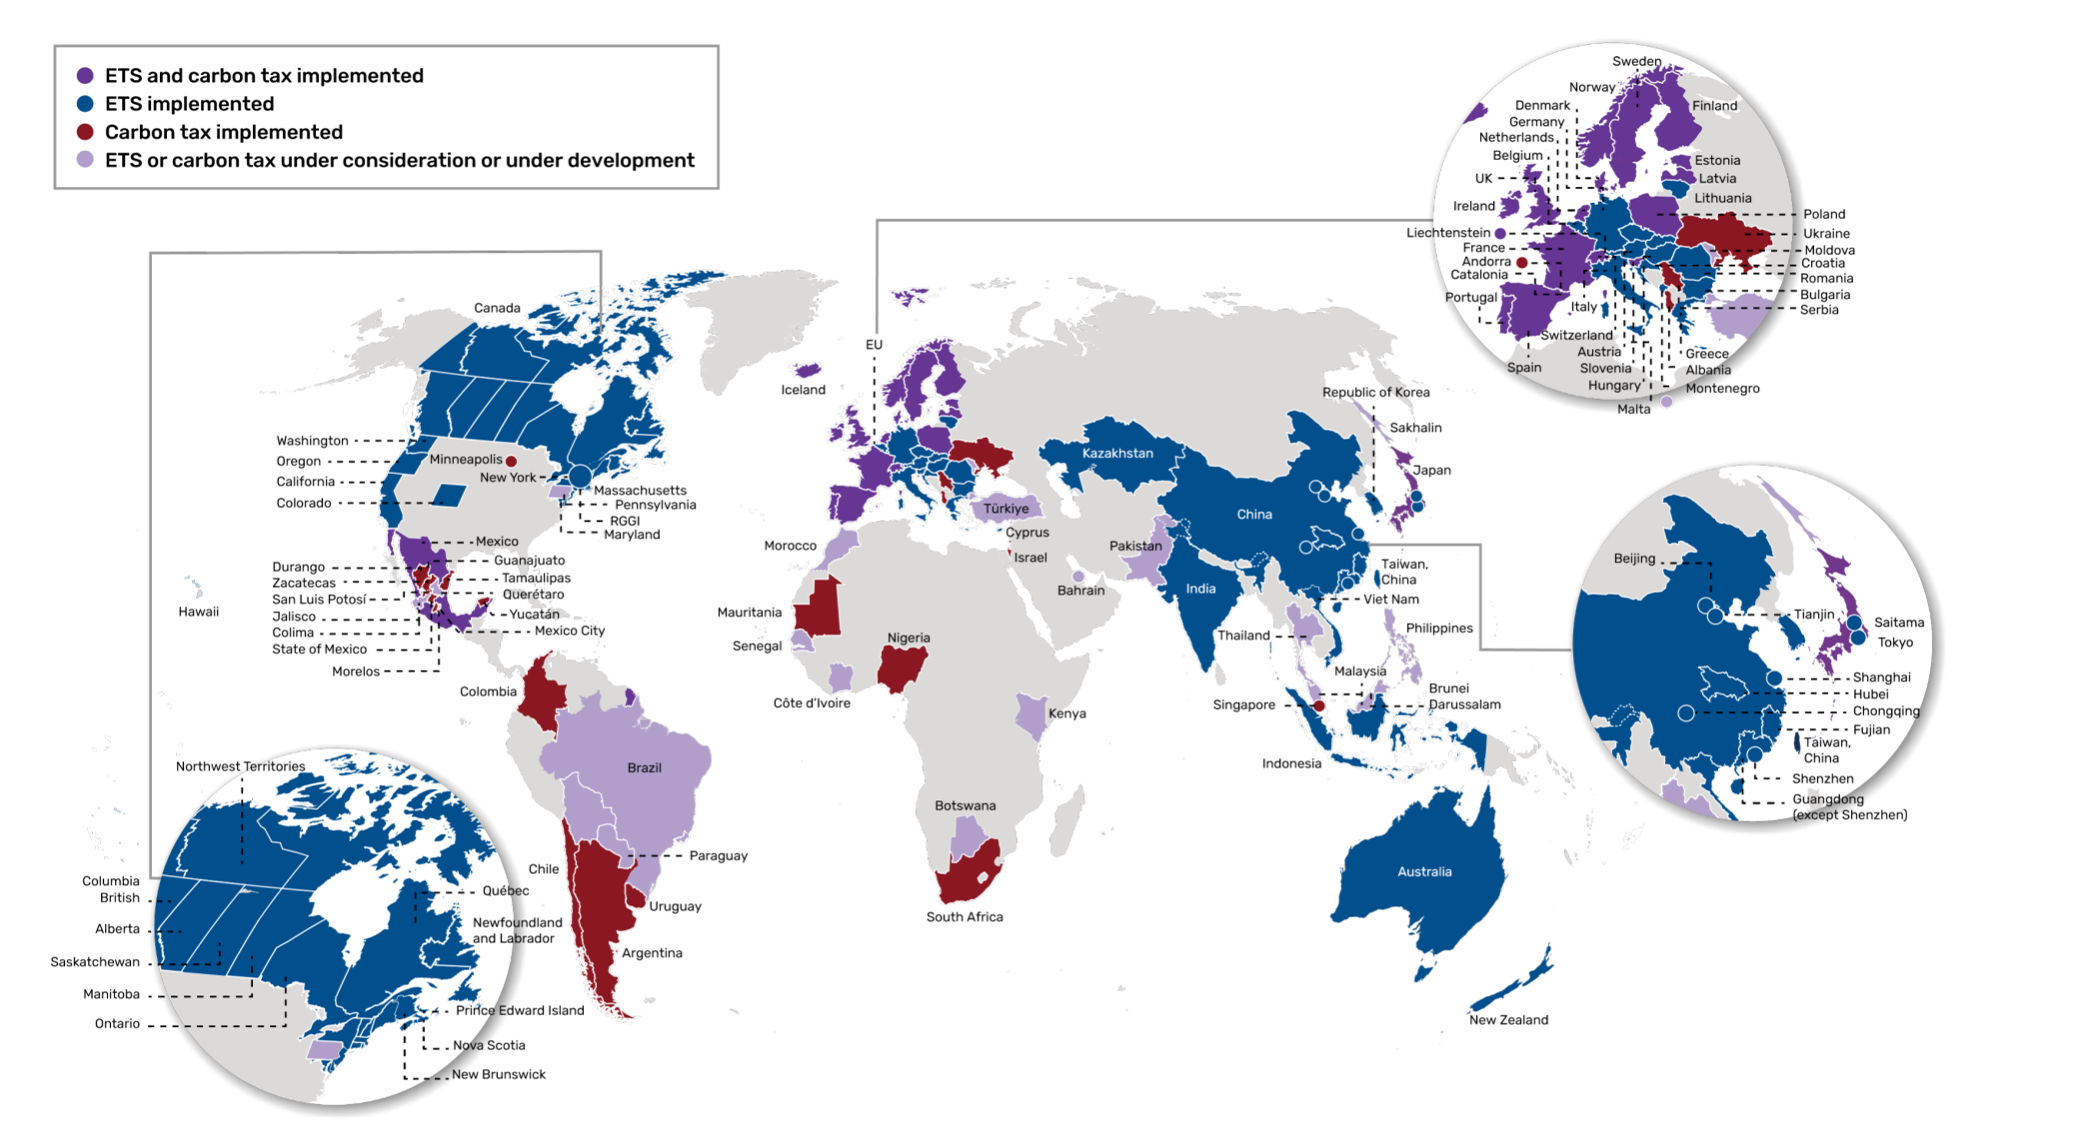
Map of ETSs and carbon taxes implemented, under consideration or under development
Newly implemented ETSs in India and Japan are among the world’s largest in terms of emissions covered. Under India’s Carbon Credit Trading Scheme (CCTS), compliance mechanism is a baseline and crediting based trading system for hard-to-abate sectors currently covering eight emission-intensive sectors. The scheme is built on Perform Achieve and Trade (PAT) Scheme which is a flagship energy efficiency program in India that reduces energy consumption in energy-intensive industries through a market-based trading mechanism. Under the this mechanism of the CCTS, obligated entities are notified with the annual Greenhouse gas Emission Intensity (GEI) targets for the defined trajectory period. Japan’s GX-ETS entered its second phase on April 1, 2026 and now mandates participation from over 700 companies, covering over 50 percent of Japan’s national GHG emissions, or approximately 524 MtCO2e. Only China’s National ETS, the EU ETS and the Republic of Korea’s ETS cover a larger amount of GHG emissions in absolute terms than India or Japan’s national ETSs. Domestic ETSs and carbon taxes cover 29 percent of global GHG emissions.
The net increase in global coverage over the past year is approximately 625 million tCO2e or 1.2 percent of global GHG emissions. Most of this increase reflects the commencement of ETSs in India and Viet Nam. In Viet Nam, liabilities under the ETS will apply to 2025 GHG emissions; it is therefore also included in the 2025 global coverage estimate. Importantly, the global coverage estimate is adjusted to account for overlap between existing systems, to avoid double counting. This includes where jurisdictions (national and subnational) cover the same emission sources or where a jurisdiction has implemented multiple carbon pricing instruments (for example, a carbon tax and an ETS). Importantly, Japan’s GX-ETS applies to activities and emission sources that are already covered by existing carbon pricing instruments—both the national carbon tax on fuels, and subnational ETSs in Tokyo and Saitama. The global coverage estimates account for these cross-policy overlaps and therefore newly implemented instruments may not lead to an increase in global totals, where the new instruments overlap with existing policies.
The success of carbon pricing counteracts its uptake—emission reductions can reduce the proportion of global GHGs covered. The introduction of new carbon pricing instruments (and the expansion of existing ones) increases the proportion of global GHG emissions covered. However, this growth is counterbalanced by the emission reductions that these policies are designed to deliver. Effective carbon pricing incentivizes businesses to cut emissions which reduces the share of global GHGs subject to a carbon price.
While the EU Carbon Border Adjustment Mechanism (CBAM) applies to less than one percent of global GHG emissions, it continues to be a driver for policy reforms. The EU’s CBAM began applying a carbon price to emissions embedded in select imports in January 2026. Early estimates suggest that the embedded GHG emissions of EU imports covered by CBAM were approximately 171 MtCO2e, which equates to approximately 0.3 percent of global GHG emissions.Although the EU CBAM’s coverage is small, it is driving other countries to consider their own carbon pricing instruments or border carbon adjustments.
Nearly one-third of global GHG emissions could be covered by carbon pricing by 2030 if planned carbon pricing instruments become operational. Carbon pricing instruments are currently under development in major emerging markets and developing economies. Moreover, the EU is also planning for the introduction of a second ETS focused on the buildings, road transport, small industry and construction sectors (EU ETS2). EU ETS2 will overlap with national level ETSs and carbon taxes that also apply to emissions from buildings and road transport.
Average carbon prices have increased for both carbon taxes and ETSs since April 2025
Average carbon prices have doubled over the past decade, primarily driven by allowance price increases in large ETSs (Figure 6). The average carbon price for emissions covered by an implemented carbon price rose seven percent compared to 2025 in real USD terms, reaching nearly US$ 21/tCO2e. Average ETS prices are currently around US$ 22/tCO2e, a rise of 6.5 percent compared to 2025, while average carbon tax rates grew by over 11 percent, reaching around US$ 19.50/tCO2e in 2026. The increase in EU ETS allowance prices over the past 12 months was the largest contributor to this increase. Average carbon tax rates increased in real terms by around 11.4 percent compared to 2025 levels. Macroeconomic factors can also be at play—a strengthening of currencies in countries with high carbon prices increased their relative value in the global weighted average, for example. While average prices have doubled in real terms compared to 2016, they remain below their 2022 peak of over US$ 25/tCO2e. However, these price fluctuations coincided with large expansions in carbon pricing coverage—the 2026 average price is based on a coverage base that is three GtCO2e, or five percent of global GHG emissions, larger than in 2022. For example, since 2024 China’s national ETS has expanded to include industrial sectors. The average carbon price metric provides a useful indication of progress, but it should not be interpreted as a comprehensive measure of ambition or effort.
Importantly, the quoted carbon prices only include direct carbon pricing instruments, and do not reflect price incentives provided by other instruments. For instance, it is also relevant to consider indirect carbon pricing, such as fuel taxes, which are included in broader measures such as the World Bank’s Total Carbon Price (TCP)34 or the OECD’s Net Effective Carbon Rate (Net ECR), which both account for direct carbon prices, fuel excise taxes, and fossil fuel subsidies that lower pre-tax fuel prices. Measuring changes in broader carbon price incentives are particularly helpful to better understand policy responses to energy price shocks. This is because they capture not only fluctuations in carbon tax rates or ETS prices but also changes in broader fuel taxes and fuel subsidies due to shifts in either policy or market prices. Average carbon prices vary significantly by region and country income level.
Regionally, the highest levels of direct carbon pricing adoption are in Europe and Central Asia and it is also the region with the highest average carbon price of US$ 68/tCO2e. The largest contributor is the EU ETS as the largest direct carbon price in the region, though there are national ETSs and carbon taxes with higher prices.
While average ETS prices increased, there was significant variation in trends of individual ETSs. Several European ETSs experienced price increases, including in the EU (7%), Switzerland (32%) and Austria and Germany (both 22%). Beyond Europe, prices in the Republic of Korea’s ETS (K-ETS) increased (64%), but auctioned allowance prices declined in California’s cap-and-invest program by approximately one percent over the past 12 months, and by 26 percent in New Zealand’s ETS. Tracking ETS allowance price changes on an annual basis fails to capture price volatility within a 12-month period, which can vary significantly.
Voluntary Carbon Market (VCM) has long been doubted about the carbon prices reflected at low level. However, those prices shall be expected to rise to a more reasonable market value while Paris Agreement 6.0 Article implemented from 1st January, 2026, with ONLY high-graded Carbon Credits to be issued.